Monday, March 21, 2016

Volatility Explosion

Volatility of the S&P 500, as measured by the VIX index, is at extreme lows given the risk and uncertainty outlook for the market.

With the VIX at 14.02, where it closed Friday,  there is 39% downside to the 25 year low of 9.3, 41% upside to the mean of 19.8, and 477% upside to the high of 81.


As the well-respected "tail risk" hedge fund, Artemis Capital puts it, "volatility reflects the difference between the world as we imagine it to be and the world that actually exists." In other words, the general sense of uncertainty is the major driver of volatility and thus of the level of the VIX index.

There are three main reasons the VIX should spike higher: corporate debt is too high relative to sustainable cash flow levels, the economy will weaken more than people think, and the market is at a negative inflection point.

Debt Ratios are High
The business debt to corporate cash flow ratio is above the pre-financial-crisis highs and suggests higher volatility ahead. When debt levels are stretched relative to a capacity to repay debt with cash, the cost of capital rises and equity values become less certain and volatility tends to rise. And the situation is even worse than the graph below indicates.


Cash flows are directly linked to profitability, and corporate profits are now rolling off of peak levels as a share of GDP. A continued downward trend in profits is likely and this will boost the debt to cash flow ratio we observe above, as cash flows decline with profitability, and further threaten the certainty of current equity values, which are already expensive on almost every valuation metric versus historic norms.


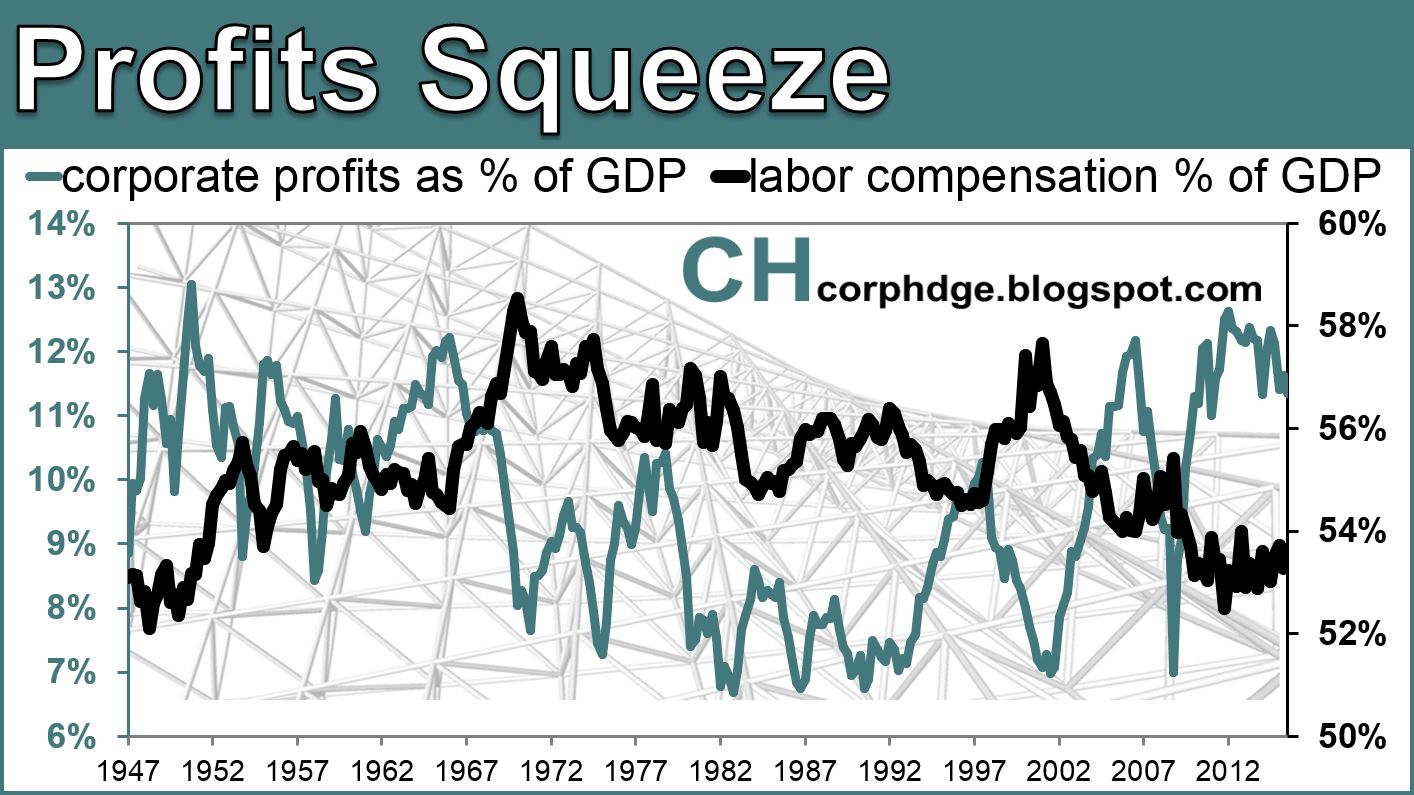
As you can see, when profits fall, volatility tends to rise. Currently the VIX is too low given the unsustainable level of and the downward trend in profits.


These high profit and debt ratios exist in an environment of zero interest rates. If the Fed continues to raise rates this will only pressure cash flows and profit as more cash is paid in interest. In fact, these issues are already being spotted by the high yield debt market, which is taking it upon itself to raise interest rates on companies of shaky credit quality.


Although the recent pullback in yield spreads has knocked down the VIX, my analysis indicates this is unsustainable. The correction in spreads has not altered the upward trend and the recent move lower has been driven by a false belief in higher economic demand, which I will explain further along in this post.


Over time, volatility and the high yield spread track along with each other. And, as I explained earlier, debt levels are too high at a time when corporate profits are rolling off of unsustainable highs and policy guided interest rates are already at zero creating a dire outlook for equity values and certainty of those equity values.


Growth Expectations are Wrong
It looks like the recent slam down in volatility was driven by a reflation trade mistaken for a true economic demand revival. Deflation has been the persistent market risk as commodity prices have fallen. Commodity producers built capacity with cheap money based on high expectations of economic demand. As demand has undershot to the downside of expectations, deflating commodity prices have reflected this demand letdown. A recent move up in inflation expectations, as seen in breakeven rates, lead the market up and drove volatility down.


This move in inflation expectations is reasonable given the bouts of quantitative easing and negative interest rates enacted by the European and Japanese central banks and the implication for US policy rates/easing measures from here on out. The main difference between what the market is doing and what is correct, is that the move higher in inflation expectations should not be based on true economic demand or a "pull" type inflation, which is the only thing that would be positive for corporate profits and market certainty at this point.

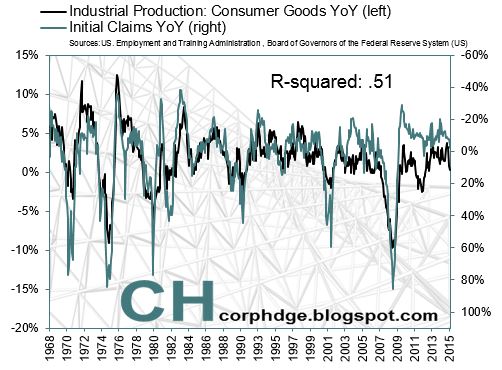
Economic uncertainty leads to market uncertainty, as shown below with the relationship between the change in jobless claims and the VIX. 


As explained in "Job Market Forecasting Depression", the rate of job-losses is at historic lows and is set to rise, and when this transpires volatility will spike higher. 


Market Inflection Point
Uncertainty is greatest when markets are falling. The following charts show the S&P 500 starting to roll over. Historically, when markets rollover like this after such a long bull run and the economic fundamentals such as jobs and corporate profits weaken, as I explain they should, uncertainty increases and prices fall quite drastically.


The market appears to be entering a new downtrend with accelerating volume, as was the case in the prior two major market crashes or corrections.


Accompanying this inflection point downwards in the market should be high uncertainty and high levels in the VIX index, but the VIX is below average and is near historic lows!


This is a unique opportunity. Volatility should be higher given that corporate profits are rolling off of peak levels, debt to cash flow ratios are near all-time highs, policy rates are at zero and expected to rise, job-losses will increase, and the market is at a turning point after a long bull market. Meanwhile, the VIX currently offers more upside to merely its historic average than it does downside to its 25 year low.

Sources: Federal Reserve database, federalreserve.gov, BLS, BEA, Chicago Board Options Exchange, Artemiscm.com


AM

Wednesday, February 10, 2016

Consumption Crash


The U.S. consumption train is flying off of the tracks. This is a vital post with essential information for every U.S. and global citizen. It is so important because many still believe in the hope of continued economic and stock market expansion on the back of a strong consumer supported by low gas prices. The facts are that oil is already down 70% and the consumption and jobs data have started to deteriorate. The probability of a low-oil-price benefit overwhelming weakness in the labor market is inconsequentially low. The following writings and graphs illustrate and explain the facts of the unfolding consumption crash. 

Firstly and most importantly, joblessness is bound to spike higher as currently the rate of improvement in the labor market is rolling off of its peak. Developing weakness in the labor market was outlined in our last post "job market forecasting depression." Jobs matter because consumers buy more stuff when they gain jobs and buy less stuff when they lose jobs. 

As the trend in jobless claims rears its ugly head to the recessionary upside, consumption will decline. These trends are beginning to transpire. The immediate graph below shows the simple truth, with 50 years of data, that when people lose jobs they buy less stuff. Simple analysis of the initial claims and consumption data reveals an r-squared, or a correlation coefficient, of .41. This means 41% of the variability in real consumption can be explained by the change in initial claims.


The evidence is already visible in the data: initial claims and real personal consumption expenditures are reversing trend in the late innings of the business-cycle.


The peak in real consumption growth, which was preceded by the peak in initial claims shrink, has passed.


Meanwhile, production of consumer goods is already on the verge of year-over-year contraction. Producers are seeing the end of the economic expansion and they will need to cut jobs to preserve their profits, which will perpetuate the downward swing in the cycle.


The recent plunge in consumer goods industrial production (IP) growth is likely to further its plunge and head into year-over-year contraction in the coming months.The long-term graph above and the ten year graph below illustrate the leading and predictive reliability of the change in consumer goods IP when forecasting the change in initial jobless claims. While IP of consumer goods contracted in 2011 and 2012, this adjustment was clearly in the early innings of a recovery. The contraction is now much more meaningful as the business cycle is stretched in duration relative to historic standards and jobless claims have begun to reaffirm the weakness in IP. 

Zooming in further, we see the reaffirmation clearly. As claims and IP move in tandem, our views of continued declines in the stock market and a recession on the horizon gain further evidence.

Further, business activity in the non-manufacturing sector is also on the verge of contraction, with the ISM nearly submerging below the 50 mark. This is further evidence of our thesis. Job losses will increase from here, as jobless claims track this ISM indicator almost perfectly throughout history.


Finally, IP of durable consumer goods foretells the crash in consumption. The changes in IP of durables and initial jobless claims represent the flow of the business-cycle over the last 50 years.


Perhaps, nothing indicates the strength of the consumer better than jobs or durable goods trends. That is why the stock market is falling as IP of durable consumer goods growth continues to slow. 


Jobs and consumer goods production/consumption measures indicate the consumption economy is on the verge of crashing on its way to business-cycle lows. 

Wednesday, February 3, 2016

Job Market Forecasting Depression

Following up on our last post, "Markets Will Crash With or Without the Federal Reserve," we reiterate the importance of the labor cycle, as indicated by initial claims data, in foreshadowing the future of economic growth and stock market results.

Initial claims are currently at historic lows as a percent of the labor force and as a percent of the population. As claims revert to typical business cycle highs, a lot of bad things will happen in the economy and markets.

Initial claims have never been this low as a percent of labor force.


The initial claims data set is not the only indicator we can rely on for forecasting the macro driven movements in markets and the unraveling or recovering of the economy. Currently, claims is particularly important given the extremity of current levels. Plus, as we observe claims alongside a preponderance (yeah, preponderance) of other data, calling the end of the current business cycle gets easier and easier, in probabilistic terms. The recession could be this year or next. Perhaps, the government won't call it a recession. The markets will. In fact, the yield on the 10-year treasury bond and the 1-year return of the Russell 2000, are both already starting to call it as we see it. Sub 2% on the ten-year bond. Russell 2000 -15%. Lick your bear chops. Not only are weekly released claims data hinting at a problem, but the daily and minute by minute market price data are clarifying the hard reality of where we are in the current cycle. 

The 10-year bond yield is crashing, while year-over-year claim declines are slowing.


And, Mr. Russell 2000? Yep, crashing too.


This will get ugly.

It is clear, to even the dumbest wall streeters among us at this point, that the industrial/manufacturing economy is in full-on recession mode. Good paying jobs come from this segment of the economy. Industrial economic activity is under stress as the weakness of our trading partners pervades the trade-related-goods-producing businesses. The domestic energy business and its supplier network are both in recession. Again, typically good paying jobs in these industries, especially for people with limited intellectual skill sets who are willing to work hard.

The weakness of our trading partners and of the energy market form the story behind the data. Regardless of the story you want to tell (perhaps it's just time and the cycle), the data is clear; the manufacturing PMI is in contraction (AKA recession) and the labor market is just beginning to reflect it. The bulk of the pain is still ahead.

Manufacturing ISM and Initial Claim data fit like a glove, historically.


We expect a continued downtrend in the manufacturing PMI, which will perpetuate higher jobless numbers and vice versa. Yes, vice versa; these relationships often turn bi-directional and the moves become exaggerated. 


Personal consumption expenditures (PCE) are shown below tracking along with initial claims throughout history. Again, this relationship indicates the importance of modeling initial claims data. The combination of these two indicators also illuminates the slowing of growth and the end of a cycle. Of course, consumption is the biggest component of GDP in the US.


Consumption growth has peaked and continues to slow. As the change in claims turns positive year-over-year, the consumption economy will worsen.


From the current extreme lows, initial jobless claims are likely to spike higher within a time horizon you can count in months and perhaps even weeks. Multiple real-time market and high-frequency economic data sets continue to indicate a slowdown that is on the verge of contraction. This spells doom for the stock market and the economic expansion investors and working citizens have benefited from over the last six years or so until now.


Wednesday, January 27, 2016

Markets Will Crash With or Without the Federal Reserve

The Fed will not stop U.S. stocks from crashing. While for the last seven years the U.S. stock market has tracked the Fed's balance sheet, the market has also simply tracked the recovery in employment. The Fed, financial news media, brokers, and much of the rest of the wall-street establishment has lulled unsuspecting investors into believing a lie. The lie is that the Fed can always stimulate the stock market. The truth is the Fed cannot prevent downturns in the economic cycle or the coincident draw-downs of investor wealth.


Initial claims data are foreshadowing the coming recession. A key indicator for tracking the most recent health of the employment market is initial claims. Initial claims is a measure of the amount of people applying for jobless benefits. When initial claims are rising, people are losing their job. Claims bottom at the crest of an economic wave and top-out at the trough. As illustrated in the chart below, initial claims reached an all-time high in October of 1982 at 695,000 and ~500,000 is the max amount of claims at the typical recessionary trough. Historically, claims bottom around 300,000. Clearly, claims indicate peak levels in this current iteration of the almighty business cycle. In fact, the peak is likely already in as claims have risen relative to the same period in the prior month (month-over-month) for 10 of the last 12 weeks.


Stocks fall as initial claims rise and vice versa. The fall in stocks is typically significant and rapid, along with the violent rise in claims. To illustrate the improvement in the labor market over the course of the current cycle, we measure the change in the spread between the all time high level of ~700,000 in initial claims and the four week average of claims. Stocks have followed this indicator almost perfectly over the last six years. 

Over the last six years the economy recovered and so did the operations of companies and the expectations around the future performance of those companies. Stocks went up.


While the labor market improved, the Fed created new reserves (printed money) through the purchase of intermediate to long-term dated bonds. The press called this Fed action "quantitative easing, or "QE." It is not clear whether QE creates wealth, but it does grow the Fed's balance sheet. It is, however, clear that for periods of time the change in the stock market correlates to the change in Fed assets (rising assets = QE).


Stocks will go down if the economy goes down. The Fed printed tons of money in the last recession, but stocks did not recover until the labor market recovered. We are on the precipice of a downturn in employment and the Fed will not be able to boost the stock market as the recessionary employment data becomes more evident.


Following the 2008 recession, employment improved and the stock market recovered. Our analysis of over 50 years of economic data clearly suggests that the strength in the labor market, as indicated by initial claims data, and the performance of the stock market are linked. The Federal reserve is a much less reliable factor to stock market performance than the economic cycle. Our view is that the current cycle is on the verge of collapse and, as a result, so too is the stock market. Over the next days and weeks, we will reveal more of our analysis on the current cycle.