Wednesday, February 10, 2016

Consumption Crash


The U.S. consumption train is flying off of the tracks. This is a vital post with essential information for every U.S. and global citizen. It is so important because many still believe in the hope of continued economic and stock market expansion on the back of a strong consumer supported by low gas prices. The facts are that oil is already down 70% and the consumption and jobs data have started to deteriorate. The probability of a low-oil-price benefit overwhelming weakness in the labor market is inconsequentially low. The following writings and graphs illustrate and explain the facts of the unfolding consumption crash. 

Firstly and most importantly, joblessness is bound to spike higher as currently the rate of improvement in the labor market is rolling off of its peak. Developing weakness in the labor market was outlined in our last post "job market forecasting depression." Jobs matter because consumers buy more stuff when they gain jobs and buy less stuff when they lose jobs. 

As the trend in jobless claims rears its ugly head to the recessionary upside, consumption will decline. These trends are beginning to transpire. The immediate graph below shows the simple truth, with 50 years of data, that when people lose jobs they buy less stuff. Simple analysis of the initial claims and consumption data reveals an r-squared, or a correlation coefficient, of .41. This means 41% of the variability in real consumption can be explained by the change in initial claims.


The evidence is already visible in the data: initial claims and real personal consumption expenditures are reversing trend in the late innings of the business-cycle.


The peak in real consumption growth, which was preceded by the peak in initial claims shrink, has passed.


Meanwhile, production of consumer goods is already on the verge of year-over-year contraction. Producers are seeing the end of the economic expansion and they will need to cut jobs to preserve their profits, which will perpetuate the downward swing in the cycle.


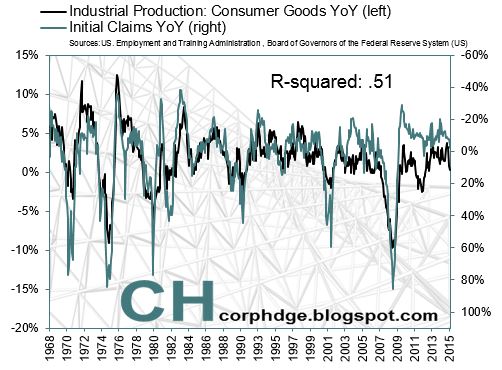
The recent plunge in consumer goods industrial production (IP) growth is likely to further its plunge and head into year-over-year contraction in the coming months.The long-term graph above and the ten year graph below illustrate the leading and predictive reliability of the change in consumer goods IP when forecasting the change in initial jobless claims. While IP of consumer goods contracted in 2011 and 2012, this adjustment was clearly in the early innings of a recovery. The contraction is now much more meaningful as the business cycle is stretched in duration relative to historic standards and jobless claims have begun to reaffirm the weakness in IP. 

Zooming in further, we see the reaffirmation clearly. As claims and IP move in tandem, our views of continued declines in the stock market and a recession on the horizon gain further evidence.

Further, business activity in the non-manufacturing sector is also on the verge of contraction, with the ISM nearly submerging below the 50 mark. This is further evidence of our thesis. Job losses will increase from here, as jobless claims track this ISM indicator almost perfectly throughout history.


Finally, IP of durable consumer goods foretells the crash in consumption. The changes in IP of durables and initial jobless claims represent the flow of the business-cycle over the last 50 years.


Perhaps, nothing indicates the strength of the consumer better than jobs or durable goods trends. That is why the stock market is falling as IP of durable consumer goods growth continues to slow. 


Jobs and consumer goods production/consumption measures indicate the consumption economy is on the verge of crashing on its way to business-cycle lows. 

Wednesday, February 3, 2016

Job Market Forecasting Depression

Following up on our last post, "Markets Will Crash With or Without the Federal Reserve," we reiterate the importance of the labor cycle, as indicated by initial claims data, in foreshadowing the future of economic growth and stock market results.

Initial claims are currently at historic lows as a percent of the labor force and as a percent of the population. As claims revert to typical business cycle highs, a lot of bad things will happen in the economy and markets.

Initial claims have never been this low as a percent of labor force.


The initial claims data set is not the only indicator we can rely on for forecasting the macro driven movements in markets and the unraveling or recovering of the economy. Currently, claims is particularly important given the extremity of current levels. Plus, as we observe claims alongside a preponderance (yeah, preponderance) of other data, calling the end of the current business cycle gets easier and easier, in probabilistic terms. The recession could be this year or next. Perhaps, the government won't call it a recession. The markets will. In fact, the yield on the 10-year treasury bond and the 1-year return of the Russell 2000, are both already starting to call it as we see it. Sub 2% on the ten-year bond. Russell 2000 -15%. Lick your bear chops. Not only are weekly released claims data hinting at a problem, but the daily and minute by minute market price data are clarifying the hard reality of where we are in the current cycle. 

The 10-year bond yield is crashing, while year-over-year claim declines are slowing.


And, Mr. Russell 2000? Yep, crashing too.


This will get ugly.

It is clear, to even the dumbest wall streeters among us at this point, that the industrial/manufacturing economy is in full-on recession mode. Good paying jobs come from this segment of the economy. Industrial economic activity is under stress as the weakness of our trading partners pervades the trade-related-goods-producing businesses. The domestic energy business and its supplier network are both in recession. Again, typically good paying jobs in these industries, especially for people with limited intellectual skill sets who are willing to work hard.

The weakness of our trading partners and of the energy market form the story behind the data. Regardless of the story you want to tell (perhaps it's just time and the cycle), the data is clear; the manufacturing PMI is in contraction (AKA recession) and the labor market is just beginning to reflect it. The bulk of the pain is still ahead.

Manufacturing ISM and Initial Claim data fit like a glove, historically.


We expect a continued downtrend in the manufacturing PMI, which will perpetuate higher jobless numbers and vice versa. Yes, vice versa; these relationships often turn bi-directional and the moves become exaggerated. 


Personal consumption expenditures (PCE) are shown below tracking along with initial claims throughout history. Again, this relationship indicates the importance of modeling initial claims data. The combination of these two indicators also illuminates the slowing of growth and the end of a cycle. Of course, consumption is the biggest component of GDP in the US.


Consumption growth has peaked and continues to slow. As the change in claims turns positive year-over-year, the consumption economy will worsen.


From the current extreme lows, initial jobless claims are likely to spike higher within a time horizon you can count in months and perhaps even weeks. Multiple real-time market and high-frequency economic data sets continue to indicate a slowdown that is on the verge of contraction. This spells doom for the stock market and the economic expansion investors and working citizens have benefited from over the last six years or so until now.